Index
ArdaSol Energy Monitor description
Introduction
ArdaSol is the project name for my solar energy and Arduino based monitoring
system. This description shows how the system is built and how it works. The
energy production of a photovoltaic plant is monitored and also the consumption
or feeding to grid of the energy. Data acquisition during a solar day and
publishing on the internet is also a function of this system.
System overview
This block diagram shows my solar plant with the ArdaSol Energy Monitoring
System.

On the roof
of my house, there is a photovoltaic plant of 3 kWp power. It produces
electrical energy, direct voltage and current (DC power). The power is fed to
an inverter, the energy will be converted to alternating current (AC Power) and
fed to the grid. The grid voltage is 230V. The solar energy will be consumed by
ourselves or fed to the public grid. Two official energy meters c1 and c2
measures the energy flows:
·
Solar Energy Produced (c2)
In Italy I get paid for this, for the next 20 years, its 23 Eurocent per kWh
·
Solar Energy fed to grid (c1)
The surplus solar energy, not used by myself, is fed to public grid, for this a
also get paid, but it’s a market price, about 7 Eurocent per kWh
·
Energy consumed from grid (c1)
When the solar
power is absent, the energy for our house is delivered from grid. ENEL (Italian
Energy Production Company) sends an invoice for the consumed energy, I have to
pay overall (energy- and network costs) 25 Eurocent per kWh.
The ArdaSol
Energy Monitoring System has 3 devices:
·
ArdaSol Display
The master of the system, collects the data from the two other ArdaSol devices,
shows the data on the display, stores it on a SD card and sends it to a server
in the internet
·
ArdaSol Energy Monitor
Measures
the consumption of the energy, shows energy values on local display and
delivers it on request to the ArdaSol display
·
ArdaSol Remote PVI Interface
The
photovoltaic inverter (PVI) has a RS485 interface, this is connected to ArdaSol
Remote, which interacts as a gateway to ArdaSol display. It converts the request,
coming with a radio signal to the PVI and vice versa
How does ArdaSol work?

The master
of ArdaSol is the Display.
I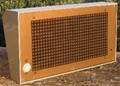
it gets the energy data from the
photovoltaic inverter (PVI) by the Remote interface and the consumed energy
from the Energy Monitor. This data acquisition is done every 20 seconds and
data is stored on an SD card for future analysis.
The Xively cloud data service will receive also the data from the display, it
is sent by an http request to the server.
You can
have a look to the data: https://xively.com/feeds/70230/
An infrared
sensor in front of the display detects a person in front of it. The data will
then display in the following manner:
Display no sequence Shows
1
Ambient temperature and Time
2
Instant Solar Power
3
Consumed Power
4
Peak Power value in day
5
Solar Energy produced in the day
6
Energy consumed
7
Total Solar Energy produced in a
year
8
Total Energy consumed in a year
9
Average Solar Energy produced in
a day
10
Average Energy consumed in a day
11
Weekday and date
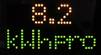
Display examples:
|
|
|
|
|
|
Ambient temperature
and time
|
790 Watt consumed
energy
|
2174 Watt peak solar
power during a day
|
8.2 kilo Watt hour
solar energy pro-duced in this day
|
Total of 2974 kilo
Watt hour consumed in a year
|
Giovedì, 12 Dicembre -> Thursday 12th of December
|


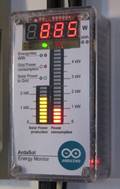
The
consumed Energy will be measured by the ArdaSol Energy Monitor
It gets the
energy consumption by a current and a voltage sensor, calculates the real
power, displays it locally and if requested by the ArdaSol Display, sends the
values back. The solar energy data will be transmitted from the display to the
Energy Monitor. Analogue LED-Bar graphs showing the solar- and consumed power
values.
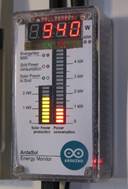
Here some
display examples:
|
|
|
|
|
940 Watt consumed
showed by 4-digit display and red LED bar graph
|
Green and red LED is
on, this means an energy value of 6.7 kWh is displayed, consumed energy in
day
|
Green LED is on, the
surplus solar power produced and fed to grid
|
This examples shows
1750 Watt solar power on yellow LED bar graph and 2230 Watt consumed
|
Red LED is on, 438
Watt are consumed from Grid, difference between consumption and solar
production
|


The
Interface between Photovoltaic Inverter (PVI) and ArdaSol Display is the
ArdaSol Remote
 Wireless communication between
ArdaSol Display and Remote Interface is done by an XBEE module. The data stream
is converted to half duplex RS485 interface to the PVI.
Wireless communication between
ArdaSol Display and Remote Interface is done by an XBEE module. The data stream
is converted to half duplex RS485 interface to the PVI.
ArdaSol Display description
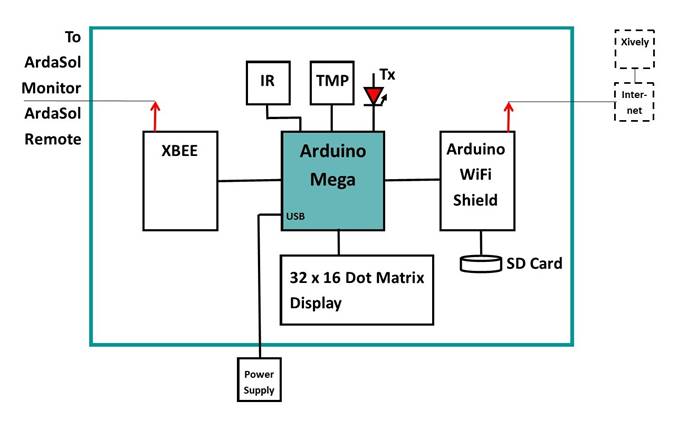
An Arduino
Mega board controls the display functions. An XBEE wireless module is connected
on a serial port and communicates to ArdaSol Energy Monitor and ArdaSol Remote
interface. The 32 x 16 dot matrix display is connected with 4 wires on the
digital outputs of the mega. The SD card on the WiFi shield stores the acquired data from the solar plant and from the energy
monitor in a formatted csv-file. Part of the data is also sent to the XIVELY
cloud service. Data is displayed only, when a person stays in front of it, due
to an infrared sensor on the front panel of the display. A TMP36 sensor is
connected to an analogue input of the Arduino and measures the ambient
temperature.
ArdaSol Energy Monitor description

The Energy
Monitor is controlled by an Arduino Uno board. A current transformer is used to
measure alternating current and a voltage transformer to measure alternating
voltage. Resistor networks adapt the signals to Arduino analogue input levels.
Now the real power used can be calculated, showed on 4-digit and LED bar graph
displays. On request by the ArdaSol Display, the Energy Monitors answers with
the energy data. For showing the solar energy production, yellow LED bar graph
indicates the amount of power produced. The data will be received from the
ArdaSol Display. Wireless radio communication is done by an XBEE module.
ArdaSol Remote Interface description
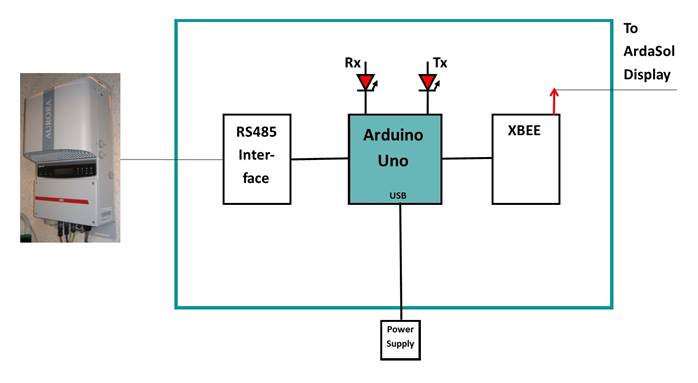
Power One /
Aurora photovoltaic inverters are able to communicate over a half duplex RS485
interface to an external unit. ArdaSol Remote Interface sends the data,
received from the XBEE module to the PVI and also sends back the answer data of
PVI. ArdaSol works in a transparent mode, this means that data is handled 1:1
in both directions.
ArdaSol Software
The Arduino software for the three devices is public available on github: https://github.com/hpieren/ArdaSol
Device
|
Folder name
|
Libraries used
|
Includes
|
Display
Arduino Mega 2560
|
ArdaSolDisplayV5_0
|
<SD.h>
<SPI.h>
<WiFi.h>
<avr/pgmspace.h>
<Time.h>
<EEPROM.h>
|
<ArdaSolDisp.ino>
Display stuff
<ArdaSolDatAcq.ino>
Data Acquisition stuff
<ArdaSolComm.ino> Communication stuff
<Font.h> Font definitions
<ht1632.h> Defintions for Holtek ht1632
LED driver.
|
Energy Monitor
Arduino Uno R3
|
ArdaSolPwrMon2_0
|
<EmonLib.h>
<SoftwareSerial.h>
<EEPROM.h>
|
|
Remote Interface
Arduino Uno R3
|
ArdaSolRemoteV3_0
|
<SoftwareSerial.h>
|
|
Conclusion
This project made to me very much pleasure and fun. I learned a lot and would
like to thank all the people, who made her know how public, most issues I could
resolve with the help of the Arduino Forum http://forum.arduino.cc/
Special
thanks to:
·
PVI
Communication Doc. on http://stephanos.io/archives/96
·
CRC16
Calculation Algorithm and Aurora communication definitions:
Curtis J. Blank curt@curtronics.com
·
Arduino
demo program for Holtek HT1632 LED driver chip
Nov, 2008 by Bill Westfield ("WestfW")Copyrighted and distributed under the terms of the Berkeley
license (copy freely, but include this notice of original author.) Dec 2010, FlorinC - adapted for 3216 display
· Open Energy for the emon library http://openenergymonitor.org/emon
Italy,
January 2014
Heinz Pieren
heinz.pieren@semprevacanze.it
